Nonfarms Payroll & Other FED Data

The top chart shows non-farms plotted with the S&P 500. It is interesting to note that in the % change charts there is a crash in the market around mid 08 this is then followed by a crash in the non-farms numbers. Although not a very rigorous analysis it looks like non-farms numbers LAG the market.
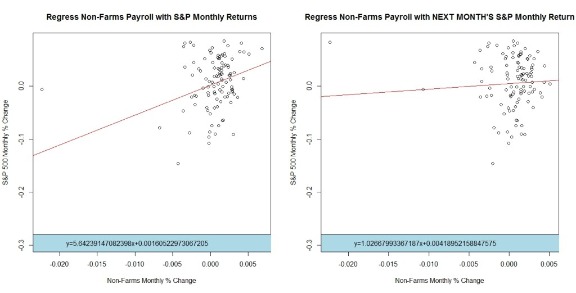
The second chart regress the % change in payrolls with the % change in the S&P for the month. It is seen in the scatter plot that there is no clear relationship between payroll change and S&P change.
The second regression on the right takes this months payroll change and regress it against next months S&P return, ie try and see if the numbers from this month can tell us anything about the return in the S&P for the coming month. Payrolls don’t look very predictive at the 1month time horizon. I think a more interesting analysis would look at payrolls on the market over 10,20,30min horizons intraday.
